The short version
America built a battery industry in about six years. More than 180 component plants have opened since 2019 across 38 states, and domestic production rose roughly 140% between 2020 and 2025. That part worked.
The next part is harder. EV sales flattened after the federal purchase credits ended in September 2025. Around ten battery projects have been cancelled or stalled, worth more than $10 billion. At the same time, grid storage took off. The U.S. installed 30.8 GWh of battery storage in the first half of 2026 alone, and SEIA has raised its 2030 forecast to 683 GWh.
So, demand did not disappear. It moved. The gap now sits in the middle of the chain, in the plants that turn rock into powder. China still makes about 80% of the world's graphite and 85 to 90% of global cathode and anode material. The U.S. handles less than 1% of lithium processing and less than 3% of nickel processing.
Our work with New Energy Nexus adds a second point. "The battery industry" is not one industry. It is seven segments with different processes, different inputs/outputs, and varying types and degree of pollution. Treating them as one risks applying the wrong assumptions to both where facilities should be built and where capital should be deployed.
Storage is now the anchor, not EVs
For three years, the case for a U.S. battery plant rested on electric cars. That case got weaker. The storage case got stronger, and fast.
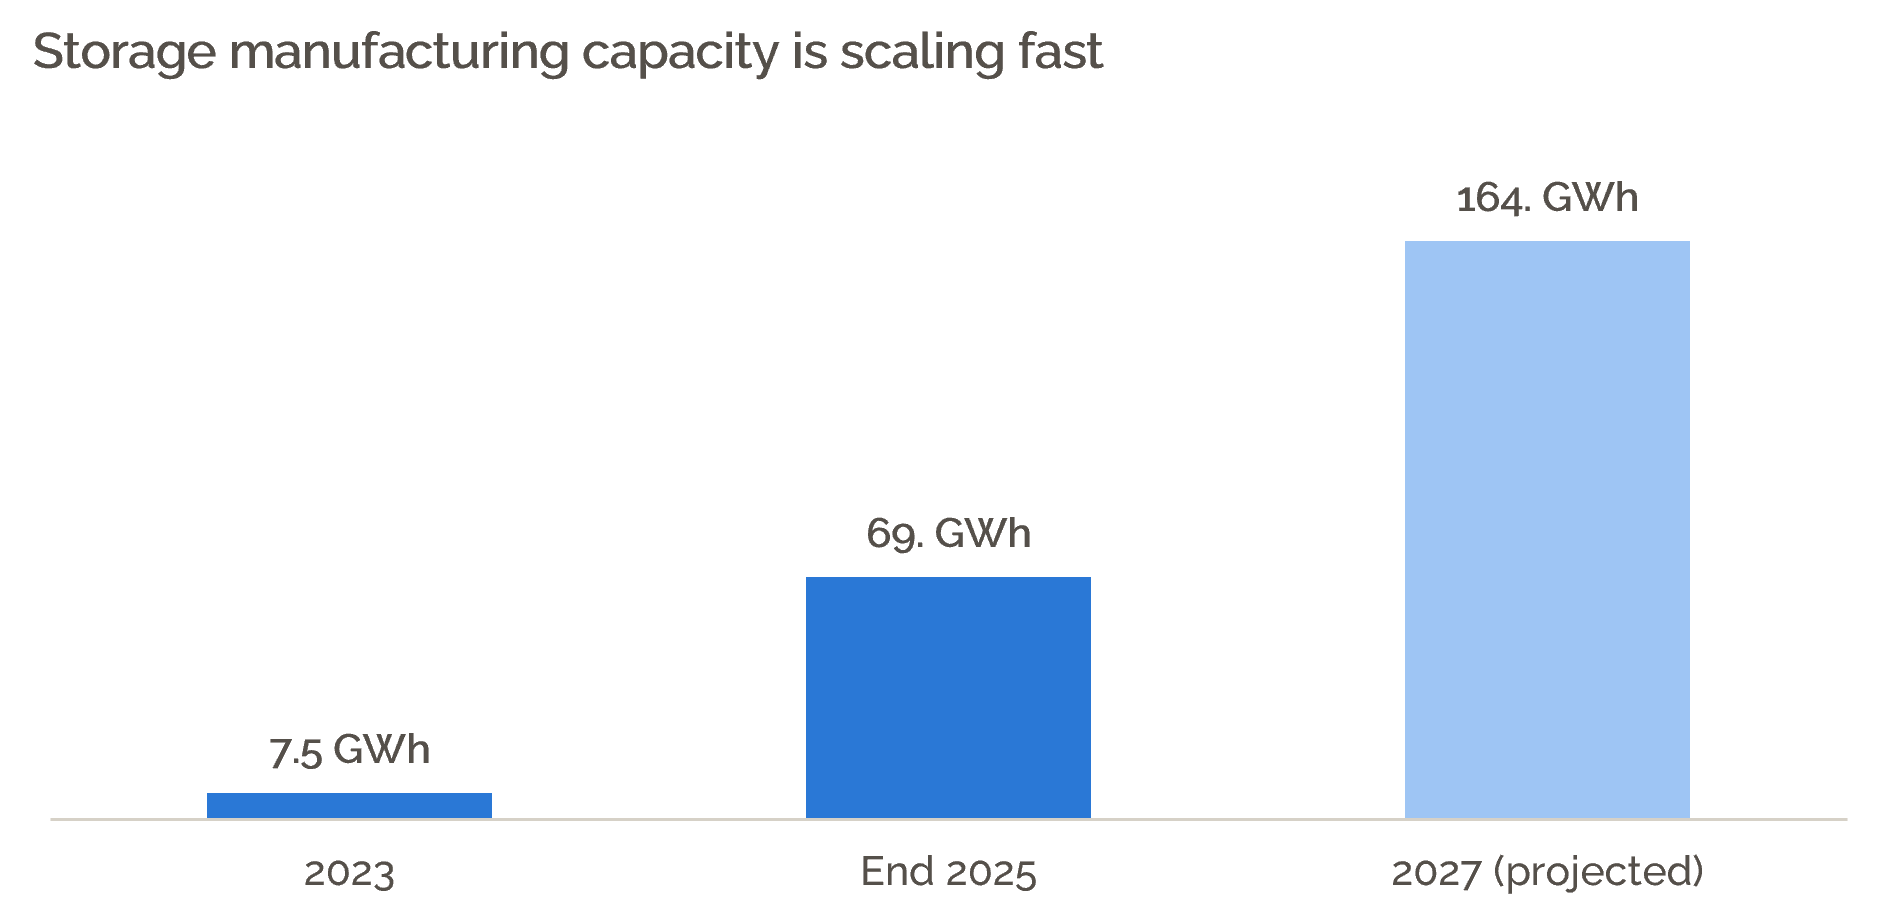
Utility-scale battery capacity nearly doubled from 88 GWh to 165 GWh in 18 months. Domestic module and system capacity went from about 7.5 GWh in 2023 to roughly 69 GWh at the end of 2025, enough to cover 100% of U.S. project demand for the first time. Tesla's Megapack plant in Lathrop, a planned systems facility near Houston, and LG Energy Solution's LFP cells in Michigan are all built around this demand.
Capital followed. Storage has now passed automotive as the leading driver of U.S. battery supply chain investment. For anyone planning a factory that changes the underwriting: a plant designed to swing between EV packs and storage systems has a far better shot at staying full.
The real gap is in the middle
Cell plants get the headlines. They are also the easiest part of the chain to import expertise for. Four Korean and Japanese companies alone are expected to support more than half of U.S. cell capacity in 2026.
The stubborn gap is upstream of them.
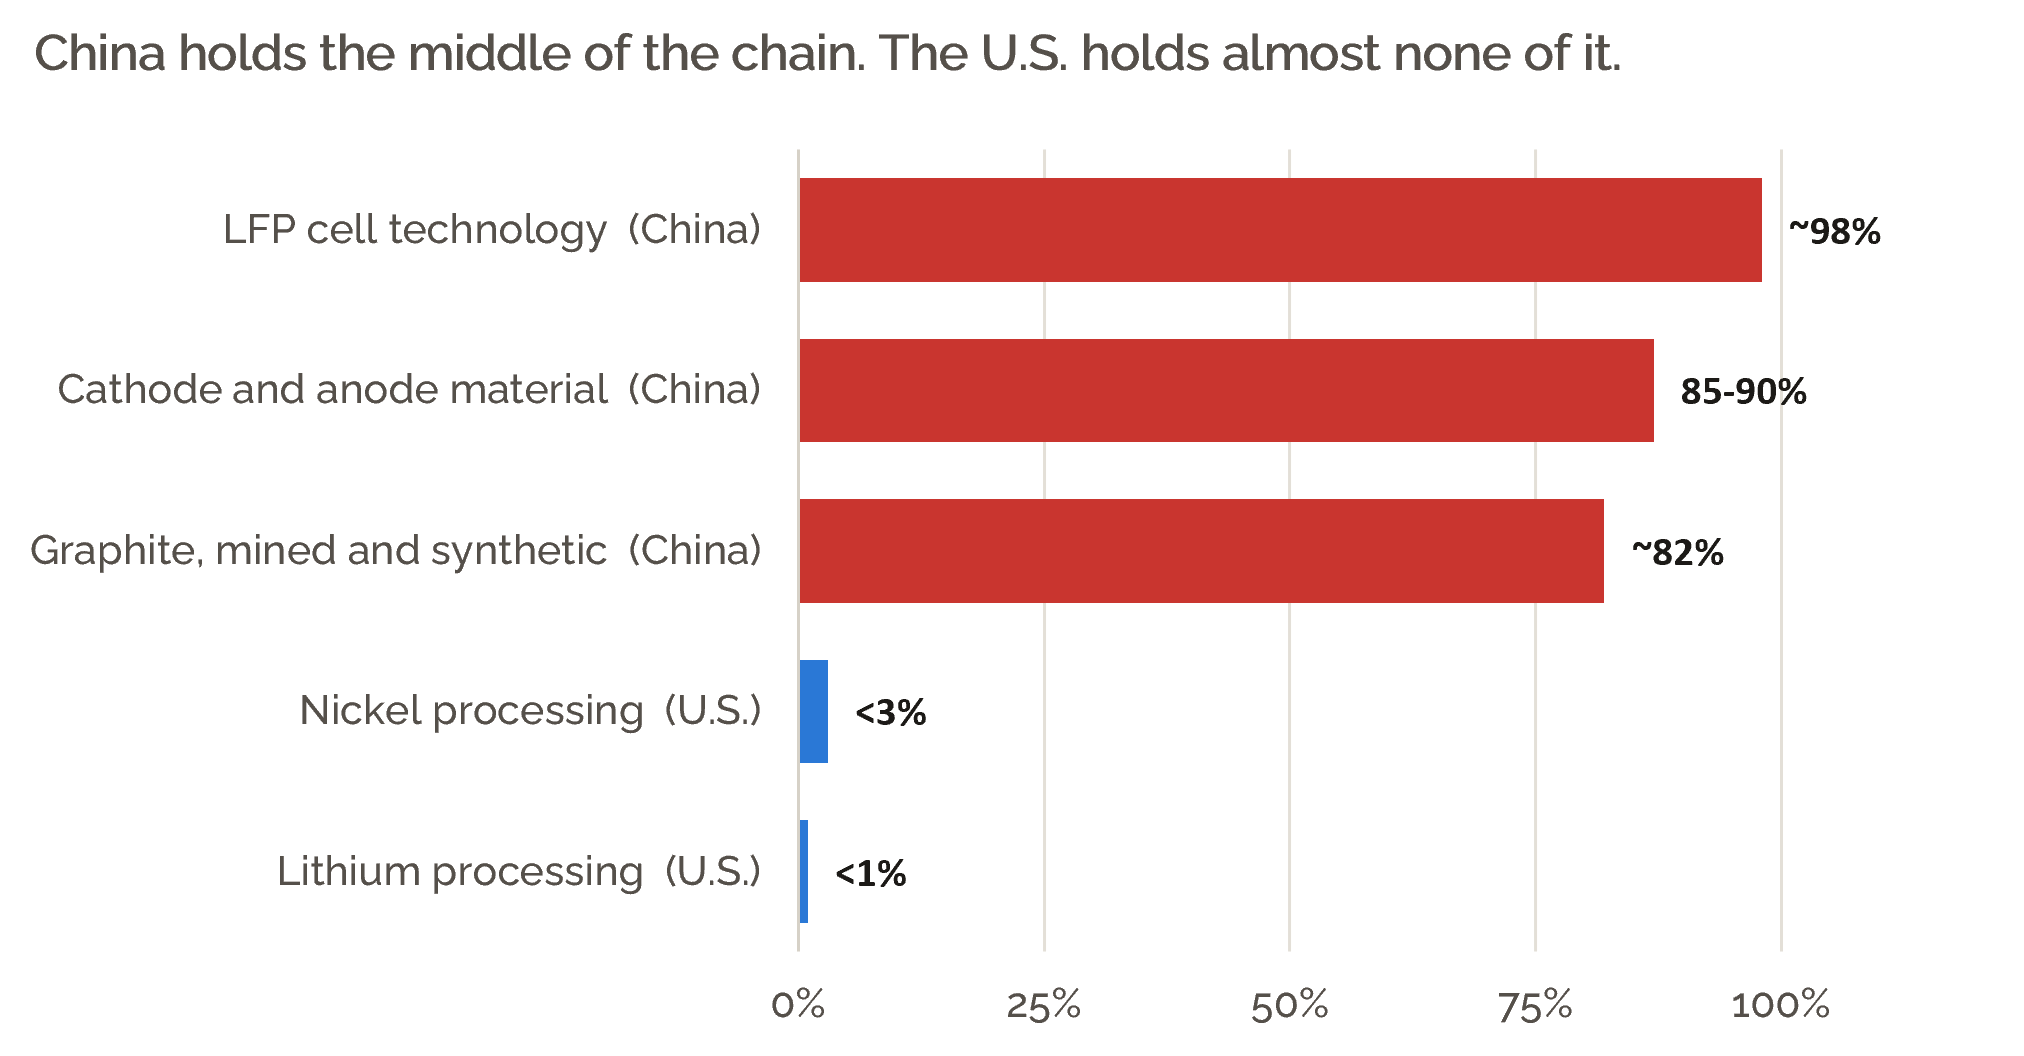
The choke point is anode graphite and cathode material, and the tariff meant to fix it never landed. Commerce set a 93.5% duty on Chinese anode material in February. The trade commission threw the case out in March, so nothing was ever collected. American anode plants are building with federal money and no price floor. Domestic output is meant to run from about 12 GWh-equivalent to 121 GWh by 2030, which assumes the announced plants get built. Piedmont Lithium walked away from its Tennessee lithium plant. Ascend Elements cut back in Kentucky, then folded in August.
Recycling has its own timing problem. Most feedstock today is factory scrap, not worn-out packs, because the EVs sold in the last five years are still on the road. Redwood Materials, the scale leader at around 20 GWh of annual processing, is building for a waste stream that mostly arrives in the 2030s. Assets priced for that stream today are hard to finance.
Seven stages, seven different answers
Working with New Energy Nexus, we assessed each stage of the chain against the environmental footprint of a large U.S. oil refinery, normalized to a 2,900-acre site. Every battery segment was scaled to that same footprint, so the comparison is like for like. The point is not any one location. It is that the seven segments behave so differently that treating them as a single industry gives you the wrong answer almost every time.
The headline number is that no battery segment comes close to the refinery. But the spread between segments is wide, and it does not fall where most people assume.
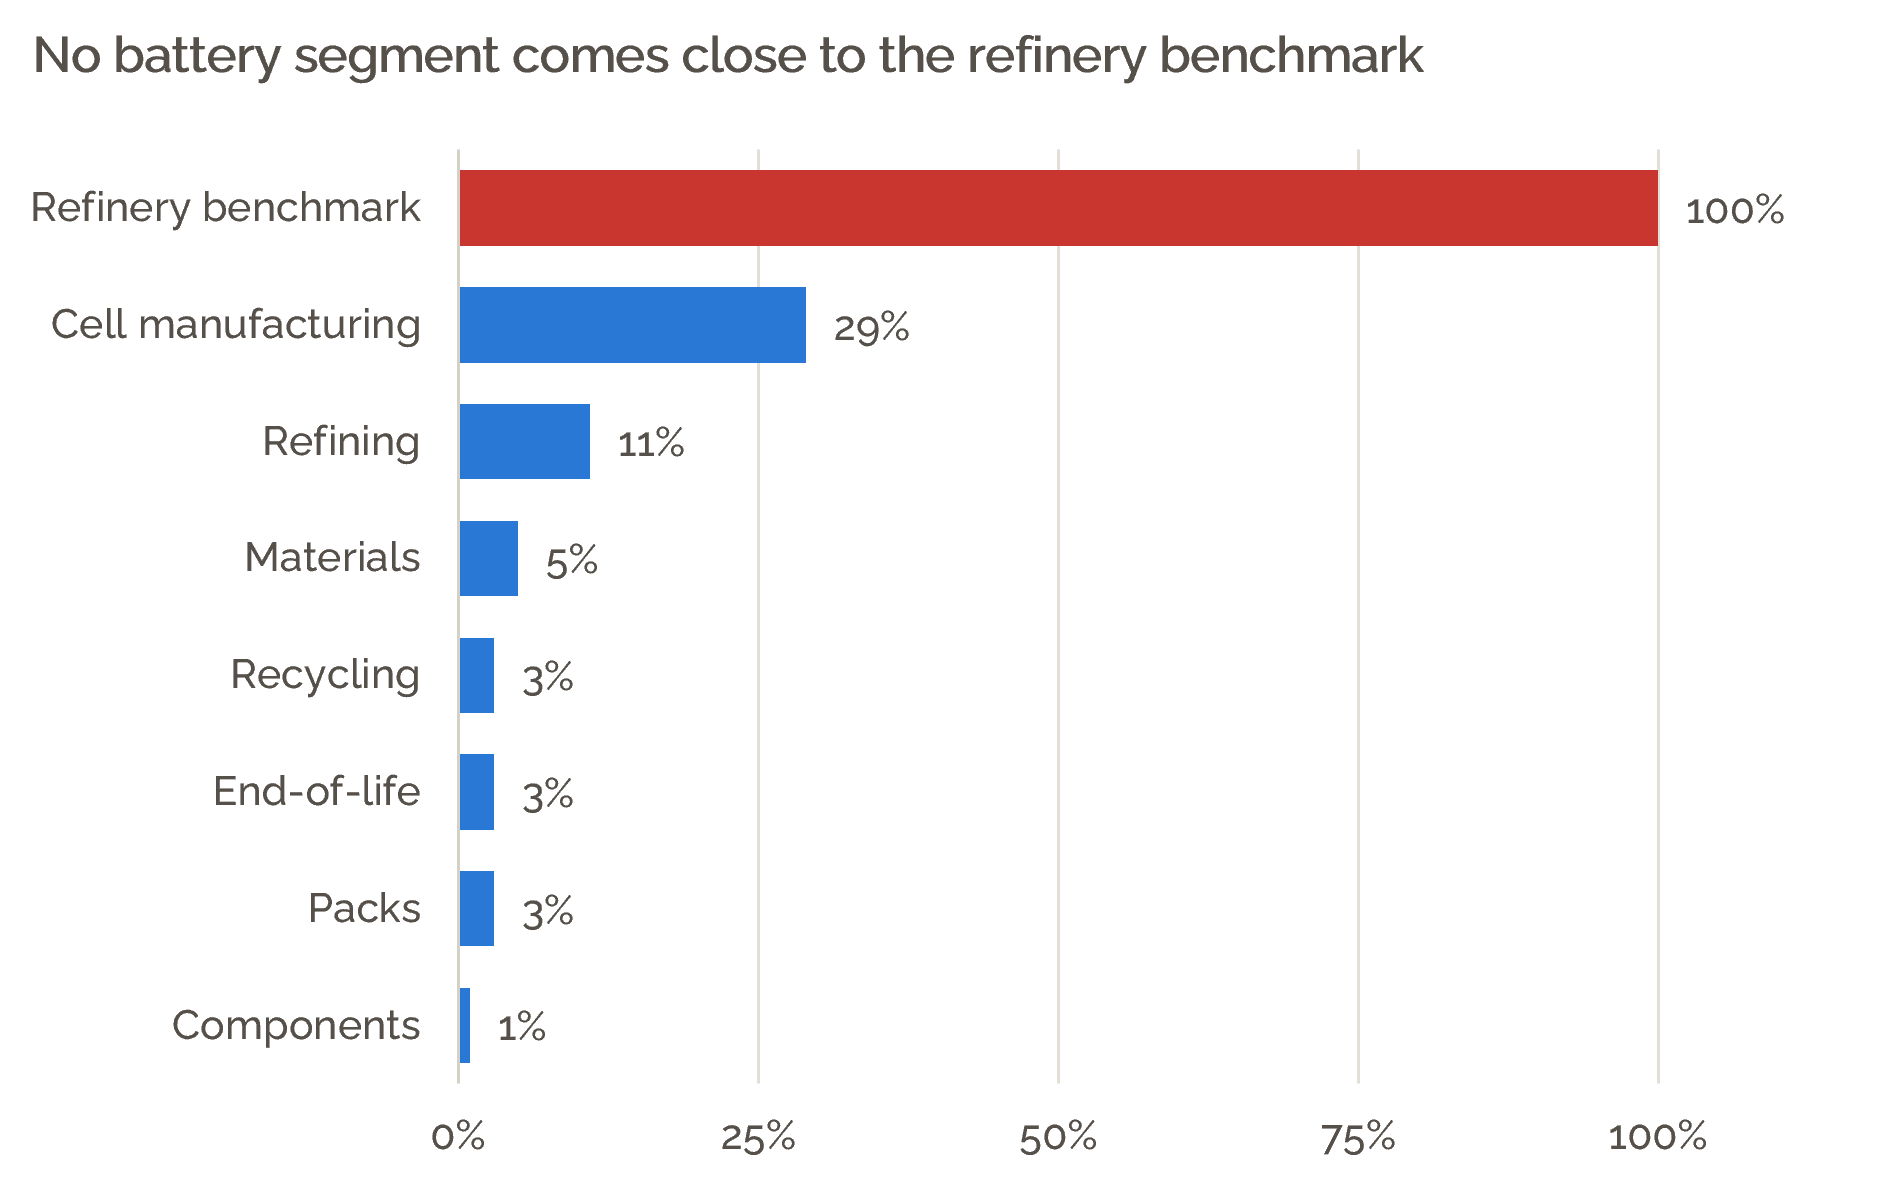
Components are the lightest at about 1% of the refinery's footprint. Packs, end-of-life and recycling all sit near 3%. Materials come in around 5%. Refining reaches 11%. Cell manufacturing is the highest at up to 29%.
Two things to hold in mind. These are ceilings rather than expected values, because every segment was sized to a full 2,900-acre facility, and most real projects are considerably smaller. And the last number surprises people, so it is worth opening up.
Cell plants have a water problem, not an air problem
The 29% figure is an average of three measures: fine particle emissions, hazardous waste, and industrial wastewater. Cell plants score low on two of them and very high on one.
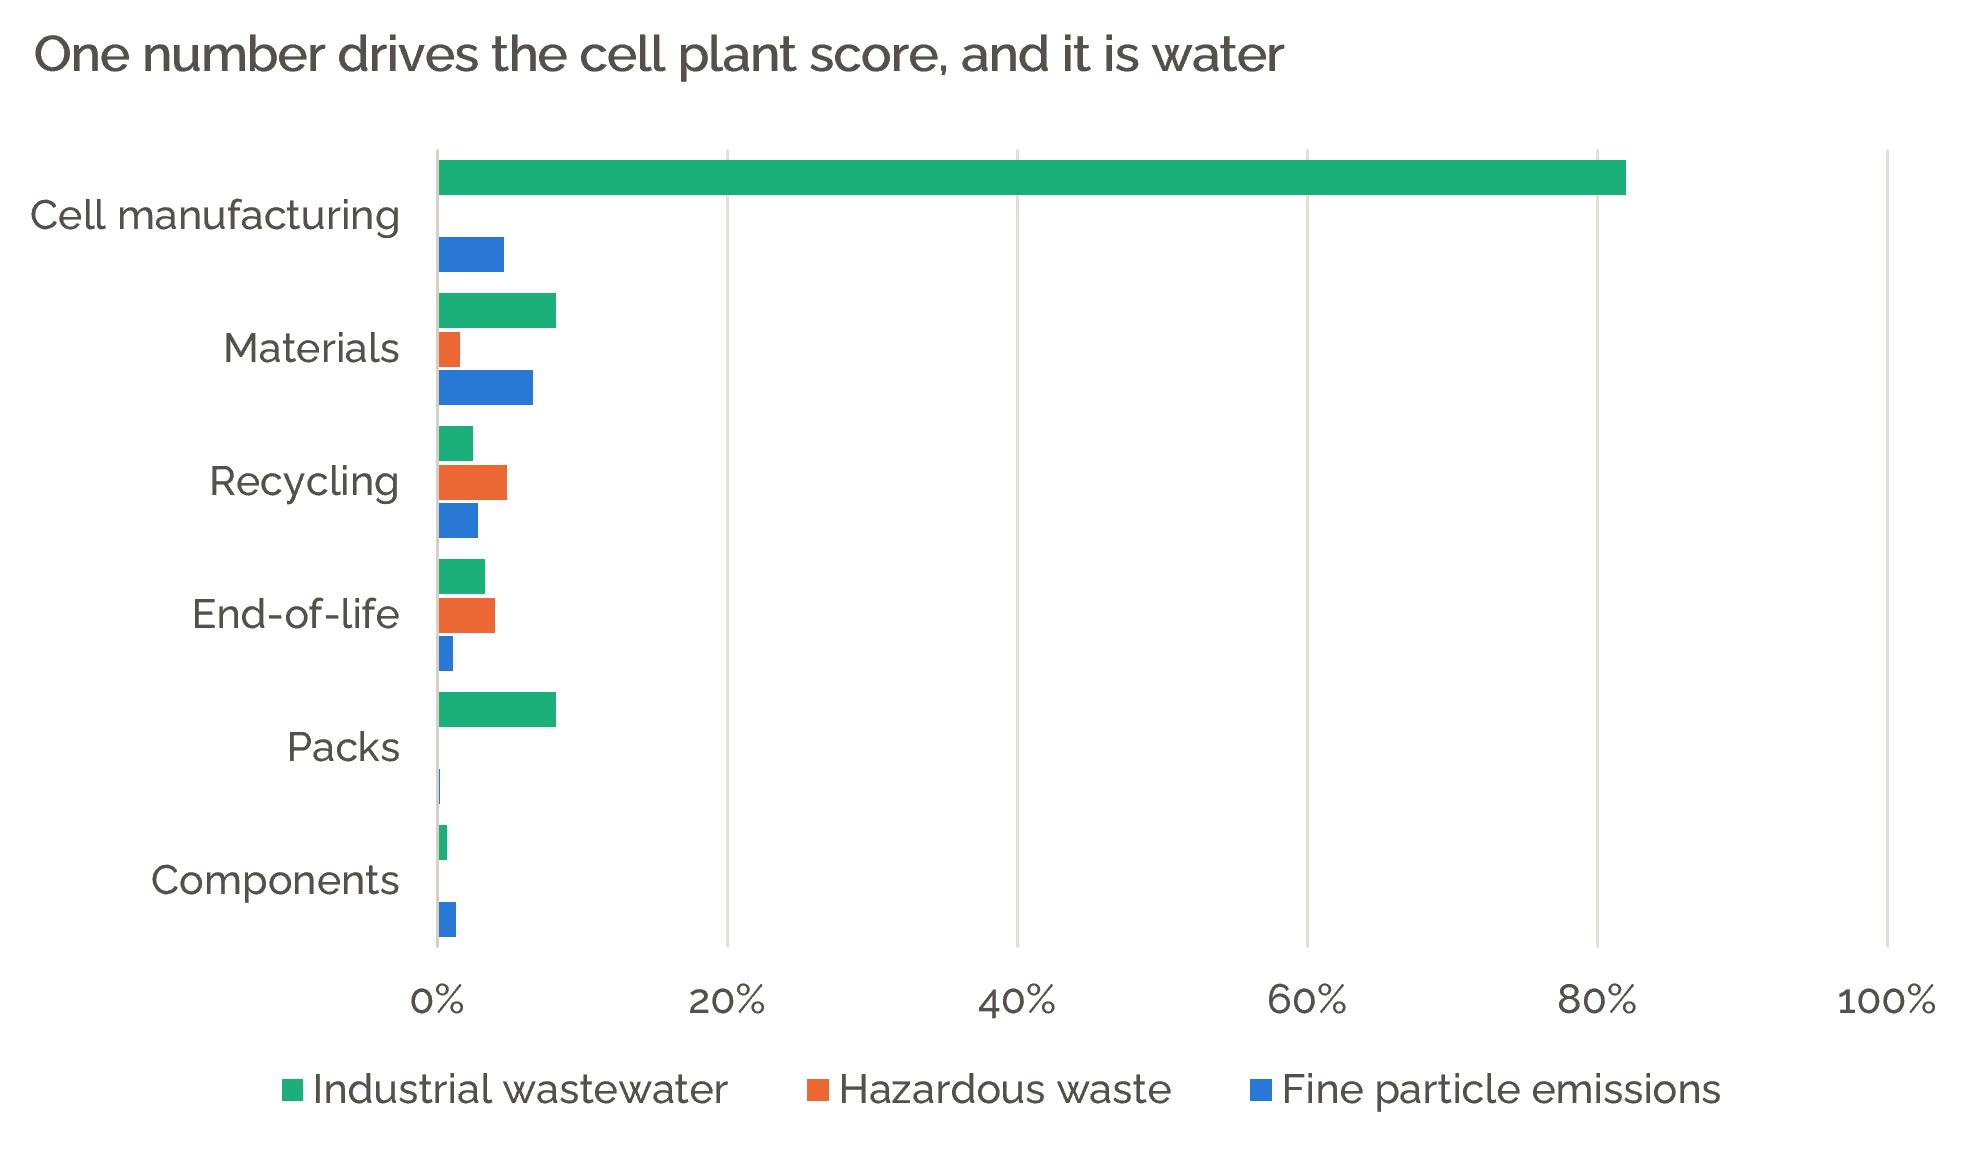
Note: Refining was excluded because feedstock cannot be sourced or moved to the region at viable scale.
On air, a cell plant runs at about 5% of the refinery. On hazardous waste, well under 1%. On industrial wastewater, it hits roughly 82%. That single measure drives the whole score.
This matters for siting anywhere. A cell plant in a region with plenty of water is a reasonable neighbor. The same plant where water is scarce is a different proposition, and it should be judged on water rather than on a general worry about chemical plants. Refining is the reverse case: its footprint is moderate, but the raw material cannot be sourced and moved at viable scale in most U.S. locations, which rules it out on logistics before the environment ever comes up.
What has to happen by 2030
- Finish the middle of the chain. Cathode, anode, precursors, salts, foils and separators, each with a signed offtake to an operating cell plant. This is where scarce capital earns the most.
- Plan to real output, not nameplate. Underwrite utilization scenarios and staged expansion. Tesla's Nevada plant was cited near 100 GWh of nameplate for years while producing closer to 30.
- Treat storage as a first-class customer. It can fill factories that EV forecasts no longer fill on their own.
- Match the segment to the place. Water capacity decides whether a cell plant fits. Watershed sensitivity decides whether nickel refining fits. Feedstock logistics decide whether synthetic graphite fits. These are answerable questions and answering them early is cheaper than answering them in a permit hearing.
- Keep policy dull and predictable. Production incentives that survive the decade, clear rules on foreign ownership so allied capital can commit, and tariffs that do not make domestic deployment unfinanceable.
Bottom line
The U.S. went from almost no modern battery base to a real one in under a decade. The scoreboard for the next five years is different. It is utilization rates, signed offtake, midstream plants running at world cost, and communities that agree to host the facilities.
The announcement era rewarded ambition. The operating era rewards matching the right stage of the chain to the right place and being honest about what each one actually costs.
Five things to do with this
- Underwrite utilization and offtake before capacity. Favor contracted demand and 5 GWh steps over maximum nameplate.
- Put scarce capital into midstream materials. Anode graphite, cathode and precursors are the highest-leverage gap.
- Design factories that can swing between EV and storage demand.
- Price policy and trade risk explicitly into factory margins, not as a footnote.
- Lead siting conversations with the specific constraint. For cell plants that is water. Vague reassurance loses rooms that a real number can win.
How this comparison was built
The environmental figures come from permitted and reported facility data rather than modelling. Air emissions are drawn from the U.S. EPA Toxics Release Inventory and regional air district filings. Water figures come from federal industrial discharge permits. Hazardous waste figures come from EPA reporting. Land footprints were checked against the Center for Land Use Interpretation, and the refinery baseline was cross-read against published analysis by PSE Healthy Energy. Each battery segment is represented by a benchmark facility for that stage, scaled to the same 2,900-acre basis. The results are upper bounds, not forecasts for any particular project.
An independent assessment reaches the same conclusion. In Contra Costa County: High-Road Battery Innovation Hub, Strategy and Action Plan (New Energy Nexus California, September 2026), a review by PSE Healthy Energy found that battery manufacturing carries "a very low risk of air pollution and water pollution," with hazardous material waste the primary risk, and that compared with legacy heavy industry such as chemical manufacturing and oil and gas, "most forms of Clean Energy Manufacturing, including battery manufacturing, pose significantly less risk to the community." The report is available at newenergynexus.com/california.